Daily Twitter trends analysis using AWS Lambda, AWS Elasticsearch and Kibana in near real time
Introduction
The trending page of Twitter reflects the mood of people in general. What if we could analyze it daily using visuals in near real time. This article covers how to build a serverless platform to achieve the same using different AWS services.
Architecture
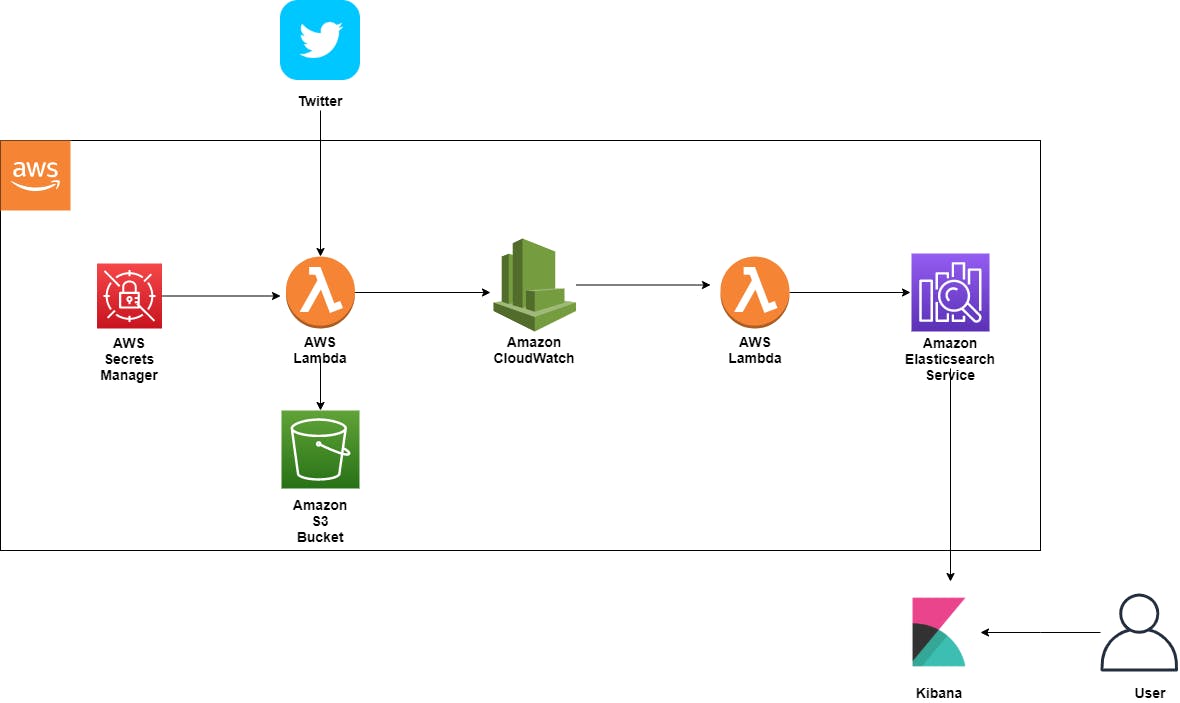
The platform has a lambda that is triggered daily at a certain time to fetch trending topics on twitter. This lambda reads twitter developer secrets from the AWS secret manager. The data fetched for the day is stored in an S3 bucket for future reference. Cloudwatch is used to store processed logs from the first lambda. There is another lambda that reads processed cloudwatch logs and streams them to AWS elasticsearch. Kibana is used to monitor and perform the visualization on trends in near real time.
Prerequisites
AWS Account
Twitter developer account
Basics of AWS CloudFormation
Java
Create AWS Resources
As a best practice, it is always recommended to created resources through CloudFormation and deploy your code through pipelines. AWS allows quick and easy provisioning of resources using CloudFormation templates. The templates are designed while keeping in mind that everything falls under the free tier limit of the AWS account so that you won't get unexpected bills. It also guarantees the minimum privilege principle, which allows the least required permissions to each resource for security reasons. It is still advised that you understand the template's configurations before you use them.
Link to cloudformation templates: github.com/ARJadhao/twitter-trends-analysis..
Using aws cloudformation create-stack command with the required parameters following resources will be created -
S3 Buckets
Secrets Manager
Lambda Deployment Pipeline
Elasticsearch cluster
Lambda Deployment
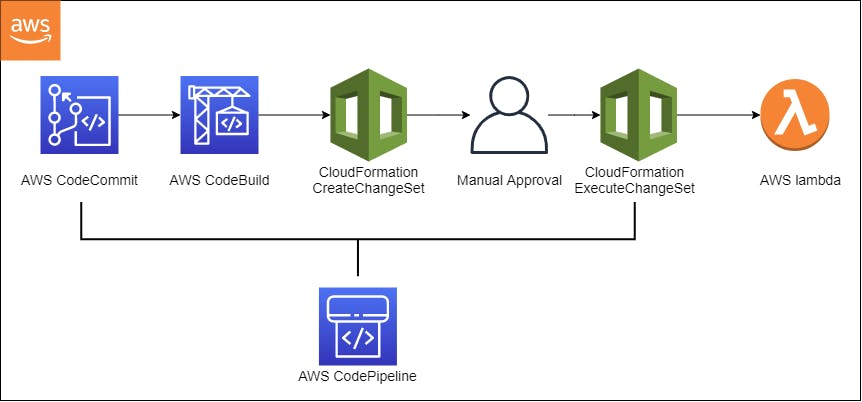 The template for lambda is written in AWS Serverless Application Model( SAM), among many features it allows you to test your lambda locally provided you have docker installed.
The deployment of lambda has been made seamless with a pipeline that triggers on every change in code commit then builds, and packages the code, and deploys the code using cloudformation.
A Lambda to fetch Twitter data
A lot of documentation is available on the Twitter developer portal about how to use Twitter API to develop apps, twitter-bots, etc. In this tutorial, the twitter4j java library is used to work with Twitter APIs. The code has basic functionality of -
- Read Twitter developer credentials from AWS secrets manager
- Create a Twitter client with available credentials
- Get trending topics for given WOEID
- Build a custom log from all the data received in the previous step and push it to Cloudwatch
- Save the data to S3 Bucket for future processing if needed
Link to full code: github.com/ARJadhao/twitter-trends-analysis..
Configure Elasticsearch & Kibana
AWS elasticsearch is one of the expensive services, so you have to careful while provisioning it.
    DevESDomain:
        Type: AWS::Elasticsearch::Domain
        Properties:
            AdvancedSecurityOptions:
                Enabled: true
                InternalUserDatabaseEnabled: true
                MasterUserOptions:
                    MasterUserName: !Ref MasterUser
                    MasterUserPassword: !Ref MasterPassword
            DomainEndpointOptions:
                EnforceHTTPS: true
                TLSSecurityPolicy: "Policy-Min-TLS-1-2-2019-07"
            DomainName: !Ref DomainName
            EBSOptions:
                EBSEnabled: true
                VolumeSize: 10
                VolumeType: "gp2"
            ElasticsearchClusterConfig:
                DedicatedMasterEnabled: false
                InstanceCount: 1
                InstanceType: "t3.small.elasticsearch"
                ZoneAwarenessEnabled: false
            ElasticsearchVersion: 7.9
            EncryptionAtRestOptions:
                Enabled: true
            NodeToNodeEncryptionOptions:
                Enabled: true
            SnapshotOptions:
                AutomatedSnapshotStartHour: 0
Above is the configuration used for this tutorial, which uses single Availability Zone, Single node cluster with free tier compatible t3.small.elasticsearch instance. There are various ways to control fine-grained access to your cluster, for the purpose of simplicity in this tutorial we will allow open access to the domain. Once elasticsearch is ready, you will have Kibana URL where you can do monitoring and analysis of data.
A lambda to stream logs to elasticsearch
You have a choice when it comes to streaming the cloudwatch logs to elasticsearch. Either use AWS provided lambda or build a custom one. You still can customize the default lambda provided by AWS. You need to create a subscription filter for log group of the first lambda with the destination as the second lambda, that ultimately perform indexing on the logs and stream it elasticsearch cluster.

You need to make sure the second lambda has proper permission to stream data to elasticsearch. You can provide permissions by modifying the lambda role by attaching the necessary policies.
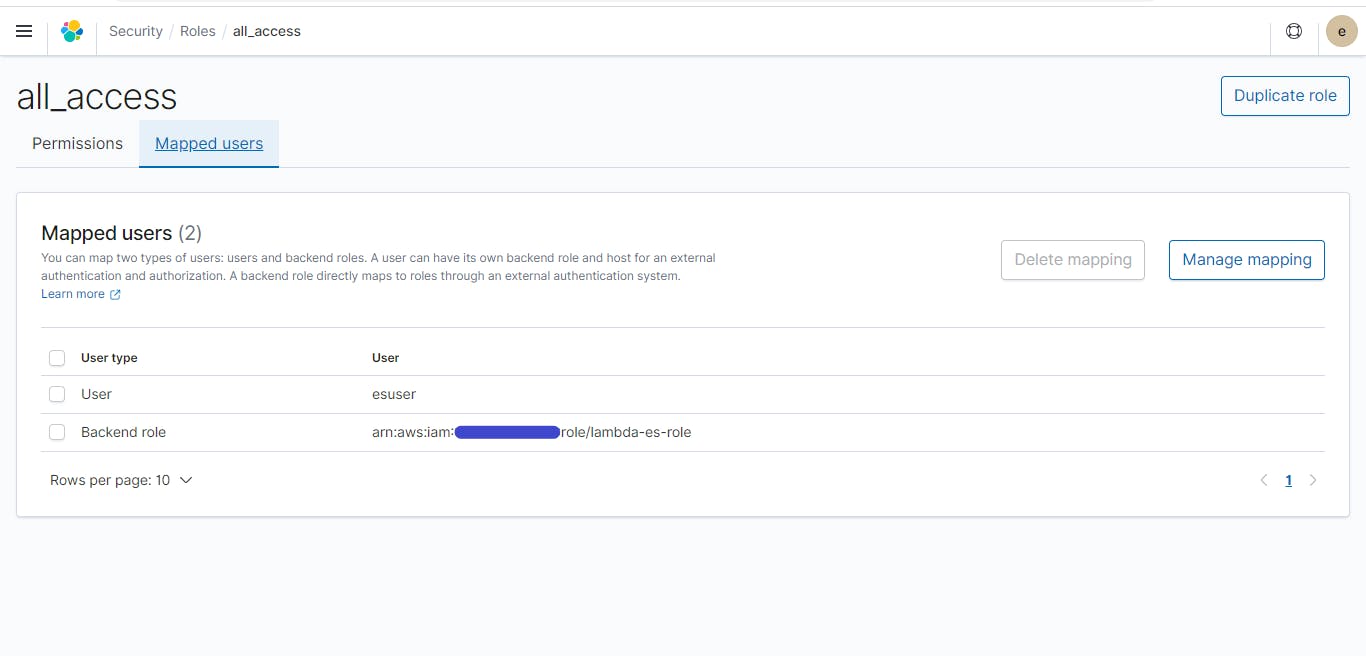 In Kibana securities console, you need to provide the lambda role as Background Role for the user
Once everything is set up, your logs should start flowing in elasticsearch.
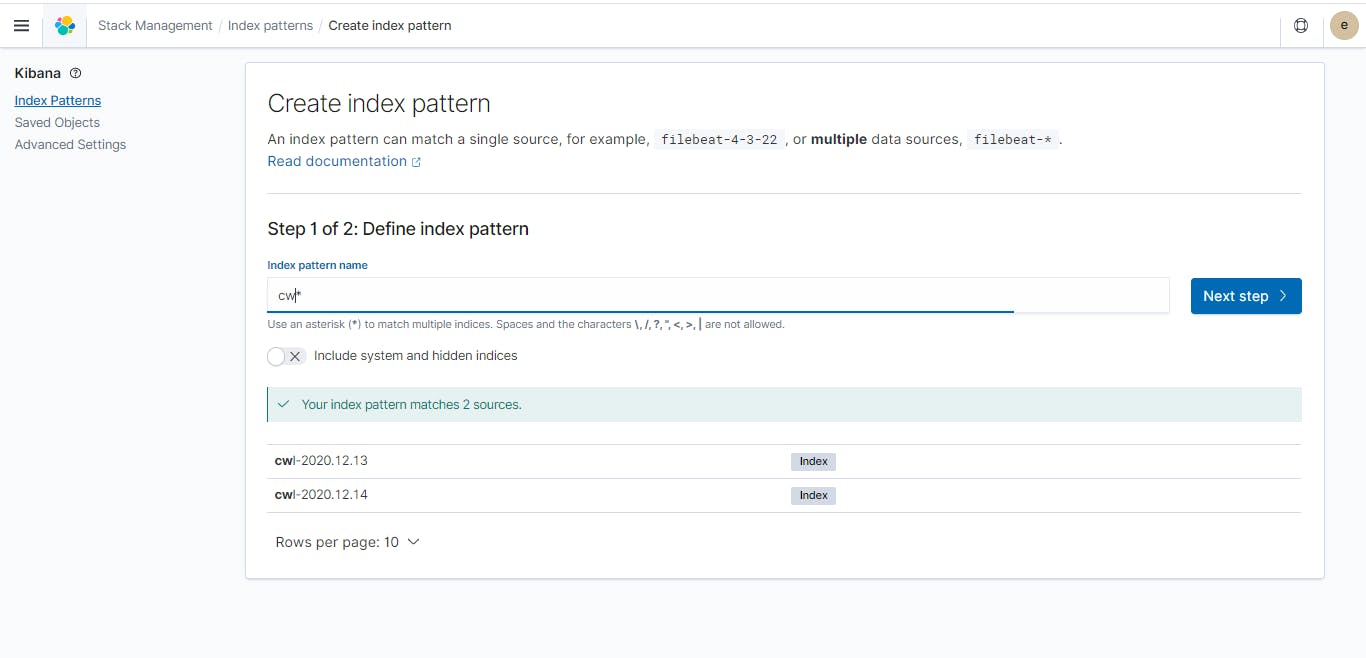 Next, you need to create an index pattern in Kibana, so that you can browse the logs and create visualizations
Discover and Analyze data
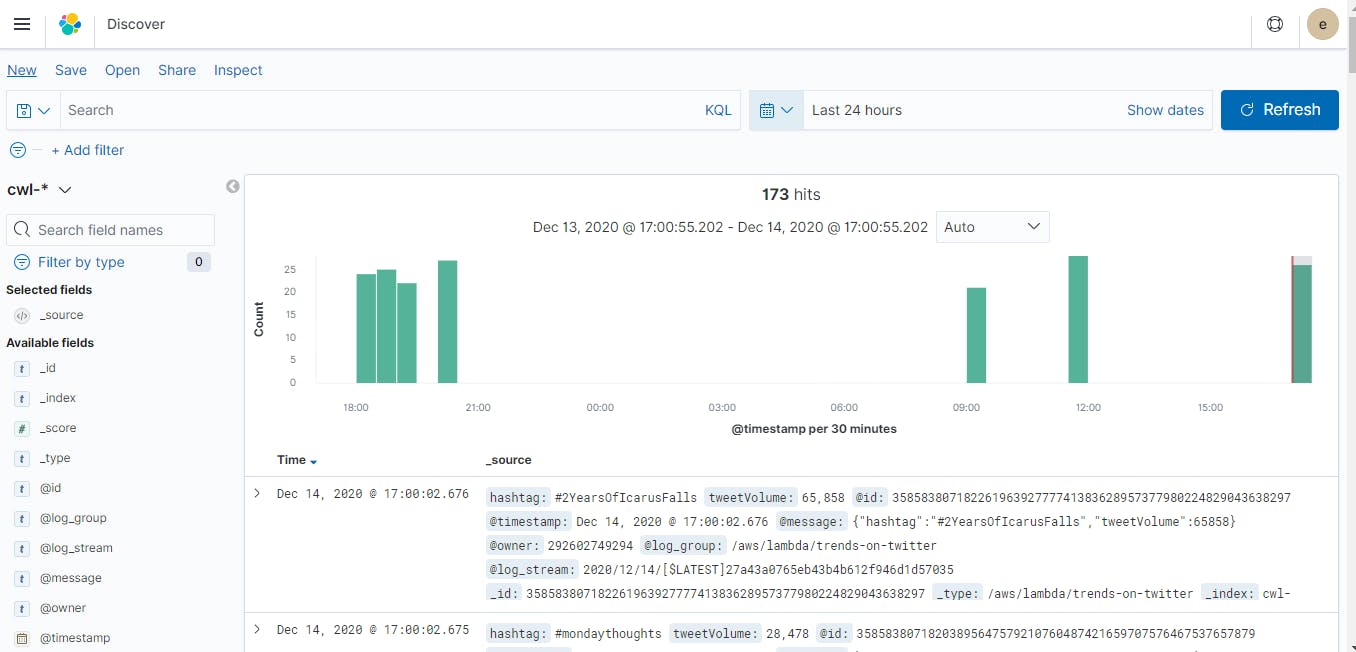
In the Discover tab of Kibana select the index pattern, time range, filters, etc and you should see all the available logs.
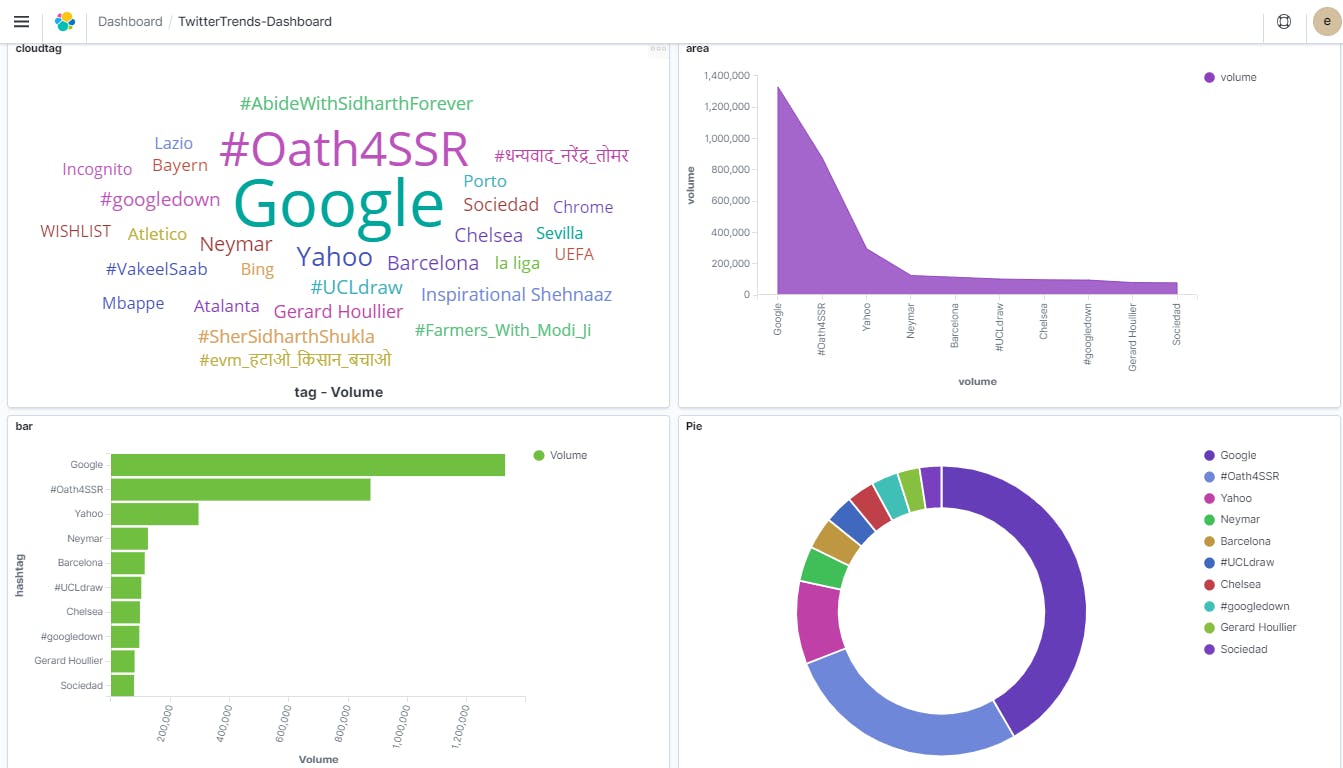
Create a dashboard
In the visualization console, you can create various types of visualizations and add them to a central dashboard for a better understanding of the data together.
Cleanup
Even though this article ensures all operations are within AWS free tier limit, it is possible that you may end up crossing that limit based on your usage.
To avoid billing for any of the services, it is important to release all your resources once done with the development. Simply run aws cloudformation delete-stack command for all the stacks created.
Conclusion
The platform uses AWS CloudFormation to provision resources and deploys them quickly using a pipeline, allowing you to focus on business logic. The same platform can be replicated in many similar use cases that need near-real-time analysis of data from various sources.
